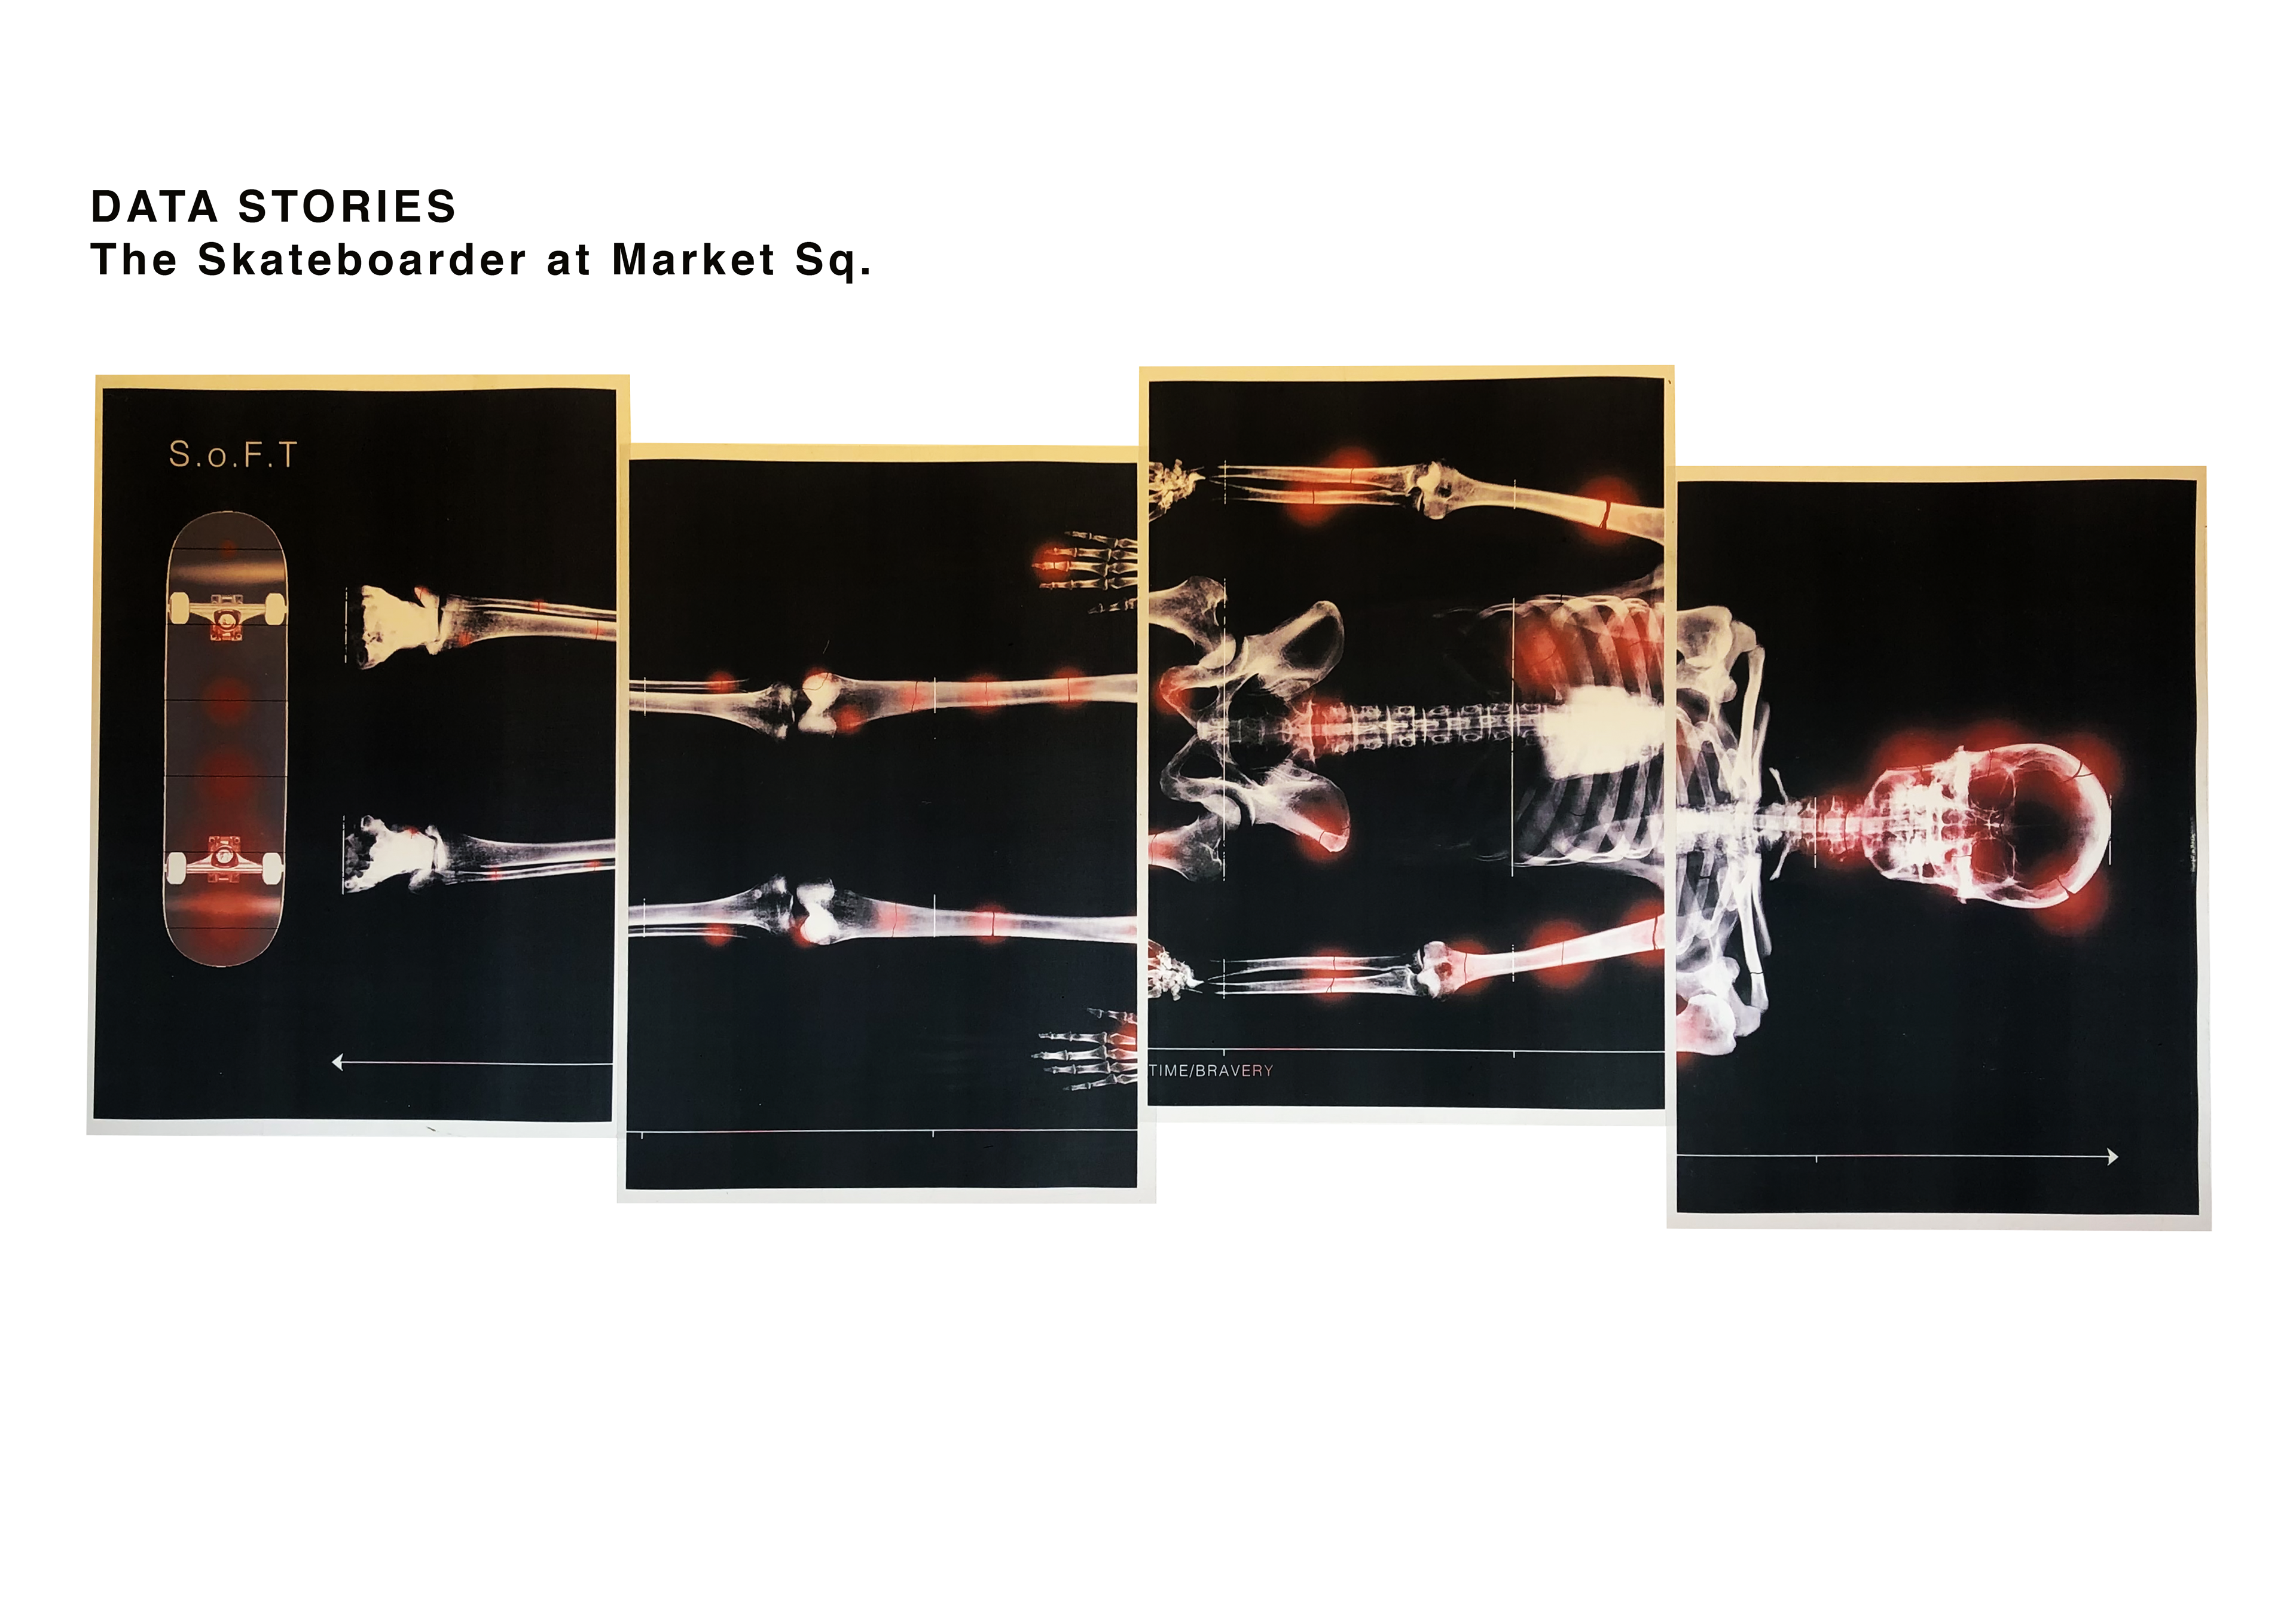
It may not be immediately obvious but look closer and you will see below is a graph. Not quite a bar chart but a more abstract reflection to quantitive data recorded on skateboarders falls in Old Market Square, Nottingham.
After I had collected data over three days I had found that the longer these skateboarders go on for, try the tricks again and again they crash worse and worse; determination.
![](https://cdn.myportfolio.com/245b8531-ade0-4248-8c60-39ac18054bda/b07506b1-92c0-4322-81ad-82c59fdb0d83_rw_3840.png?h=f17f1f9d1765df86b605f2bd39ad3ec7)
![](https://cdn.myportfolio.com/245b8531-ade0-4248-8c60-39ac18054bda/f24962c7-2ff9-4ef4-944d-90185bc8f4fc_rw_1920.jpg?h=f06f7b58b35331982014fb49bd17a22b)
![](https://cdn.myportfolio.com/245b8531-ade0-4248-8c60-39ac18054bda/802977ff-1270-4b34-a87c-303ed06455f8_rw_3840.jpg?h=a317dc2f2133d8beb56965568618e77c)
![](https://cdn.myportfolio.com/245b8531-ade0-4248-8c60-39ac18054bda/3757a9d6-bac7-4e42-9935-c5655c7cb660_rw_3840.jpg?h=2a7908049ebee3a88137f6237f2d8341)